Ten years of tenure-track jobs on LINGUIST List
LINGUIST List, academic job market, tenure-track, linguistics subfields, web scraping
If you’re about to choose a PhD program (or a subfield within one), you may wonder which areas have the most tenure-track jobs. We can’t predict the future, but the past is at least countable, so I decided to count it.
For a long time LINGUIST List has been one of the main places where linguistics jobs get posted. Every post is archived and tagged with a type (“Jobs”, “Calls”, “Books”, etc.), and job posts list one or more subfields from a fixed set of about 30 options. That makes the archive a reasonable dataset, as long as someone is willing to go through a few thousand pages.
The scraping
I didn’t do it by hand, of course. I asked Claude Code to search the archive for every job post from the last ten years and to build a figure comparing subfields over time. Here is roughly what happened:
- Indexing. The archive’s search page can filter by type and date, so the first step was to collect the address and subject line of every post tagged “Jobs” between July 2016 and October 2026. There are 4,799 of them.
- Fetching. Each post then had to be downloaded individually. The first attempt sent four requests at a time, and the server quickly started returning
429 Too Many Requests. The final version sends one request every second or two and waits whenever the server complains, so the whole thing took a few hours. Most of that time was just waiting. - Parsing. Every post has a job title, a rank (“Assistant Professor”, “Post Doc”, “Lecturer”, etc.) and a list of subfields in the subject line. Languages and free-text specialties in that list are ignored; only LINGUIST List’s own subfield labels are kept.
- Deciding what counts as tenure-track. A post counts if it explicitly says tenure-track, tenure-stream, tenured, etc. (but not non-tenure-track). It also counts if its rank is professorial and nothing in the ad suggests a visiting, adjunct, teaching-track, fixed-term or postdoctoral position. The second rule exists because plenty of tenure-track ads never use the word, and because many permanent positions in Europe don’t use the North American terminology at all.
The last step is the weakest one, as you can imagine. I checked the classifier by hand on about a hundred ads, and it does a decent job, but there is no doubt that some ads are misclassified in both directions.
The figure
The years below are job-market seasons (July to June), not calendar years, since that’s how the academic market works (at least in North America).
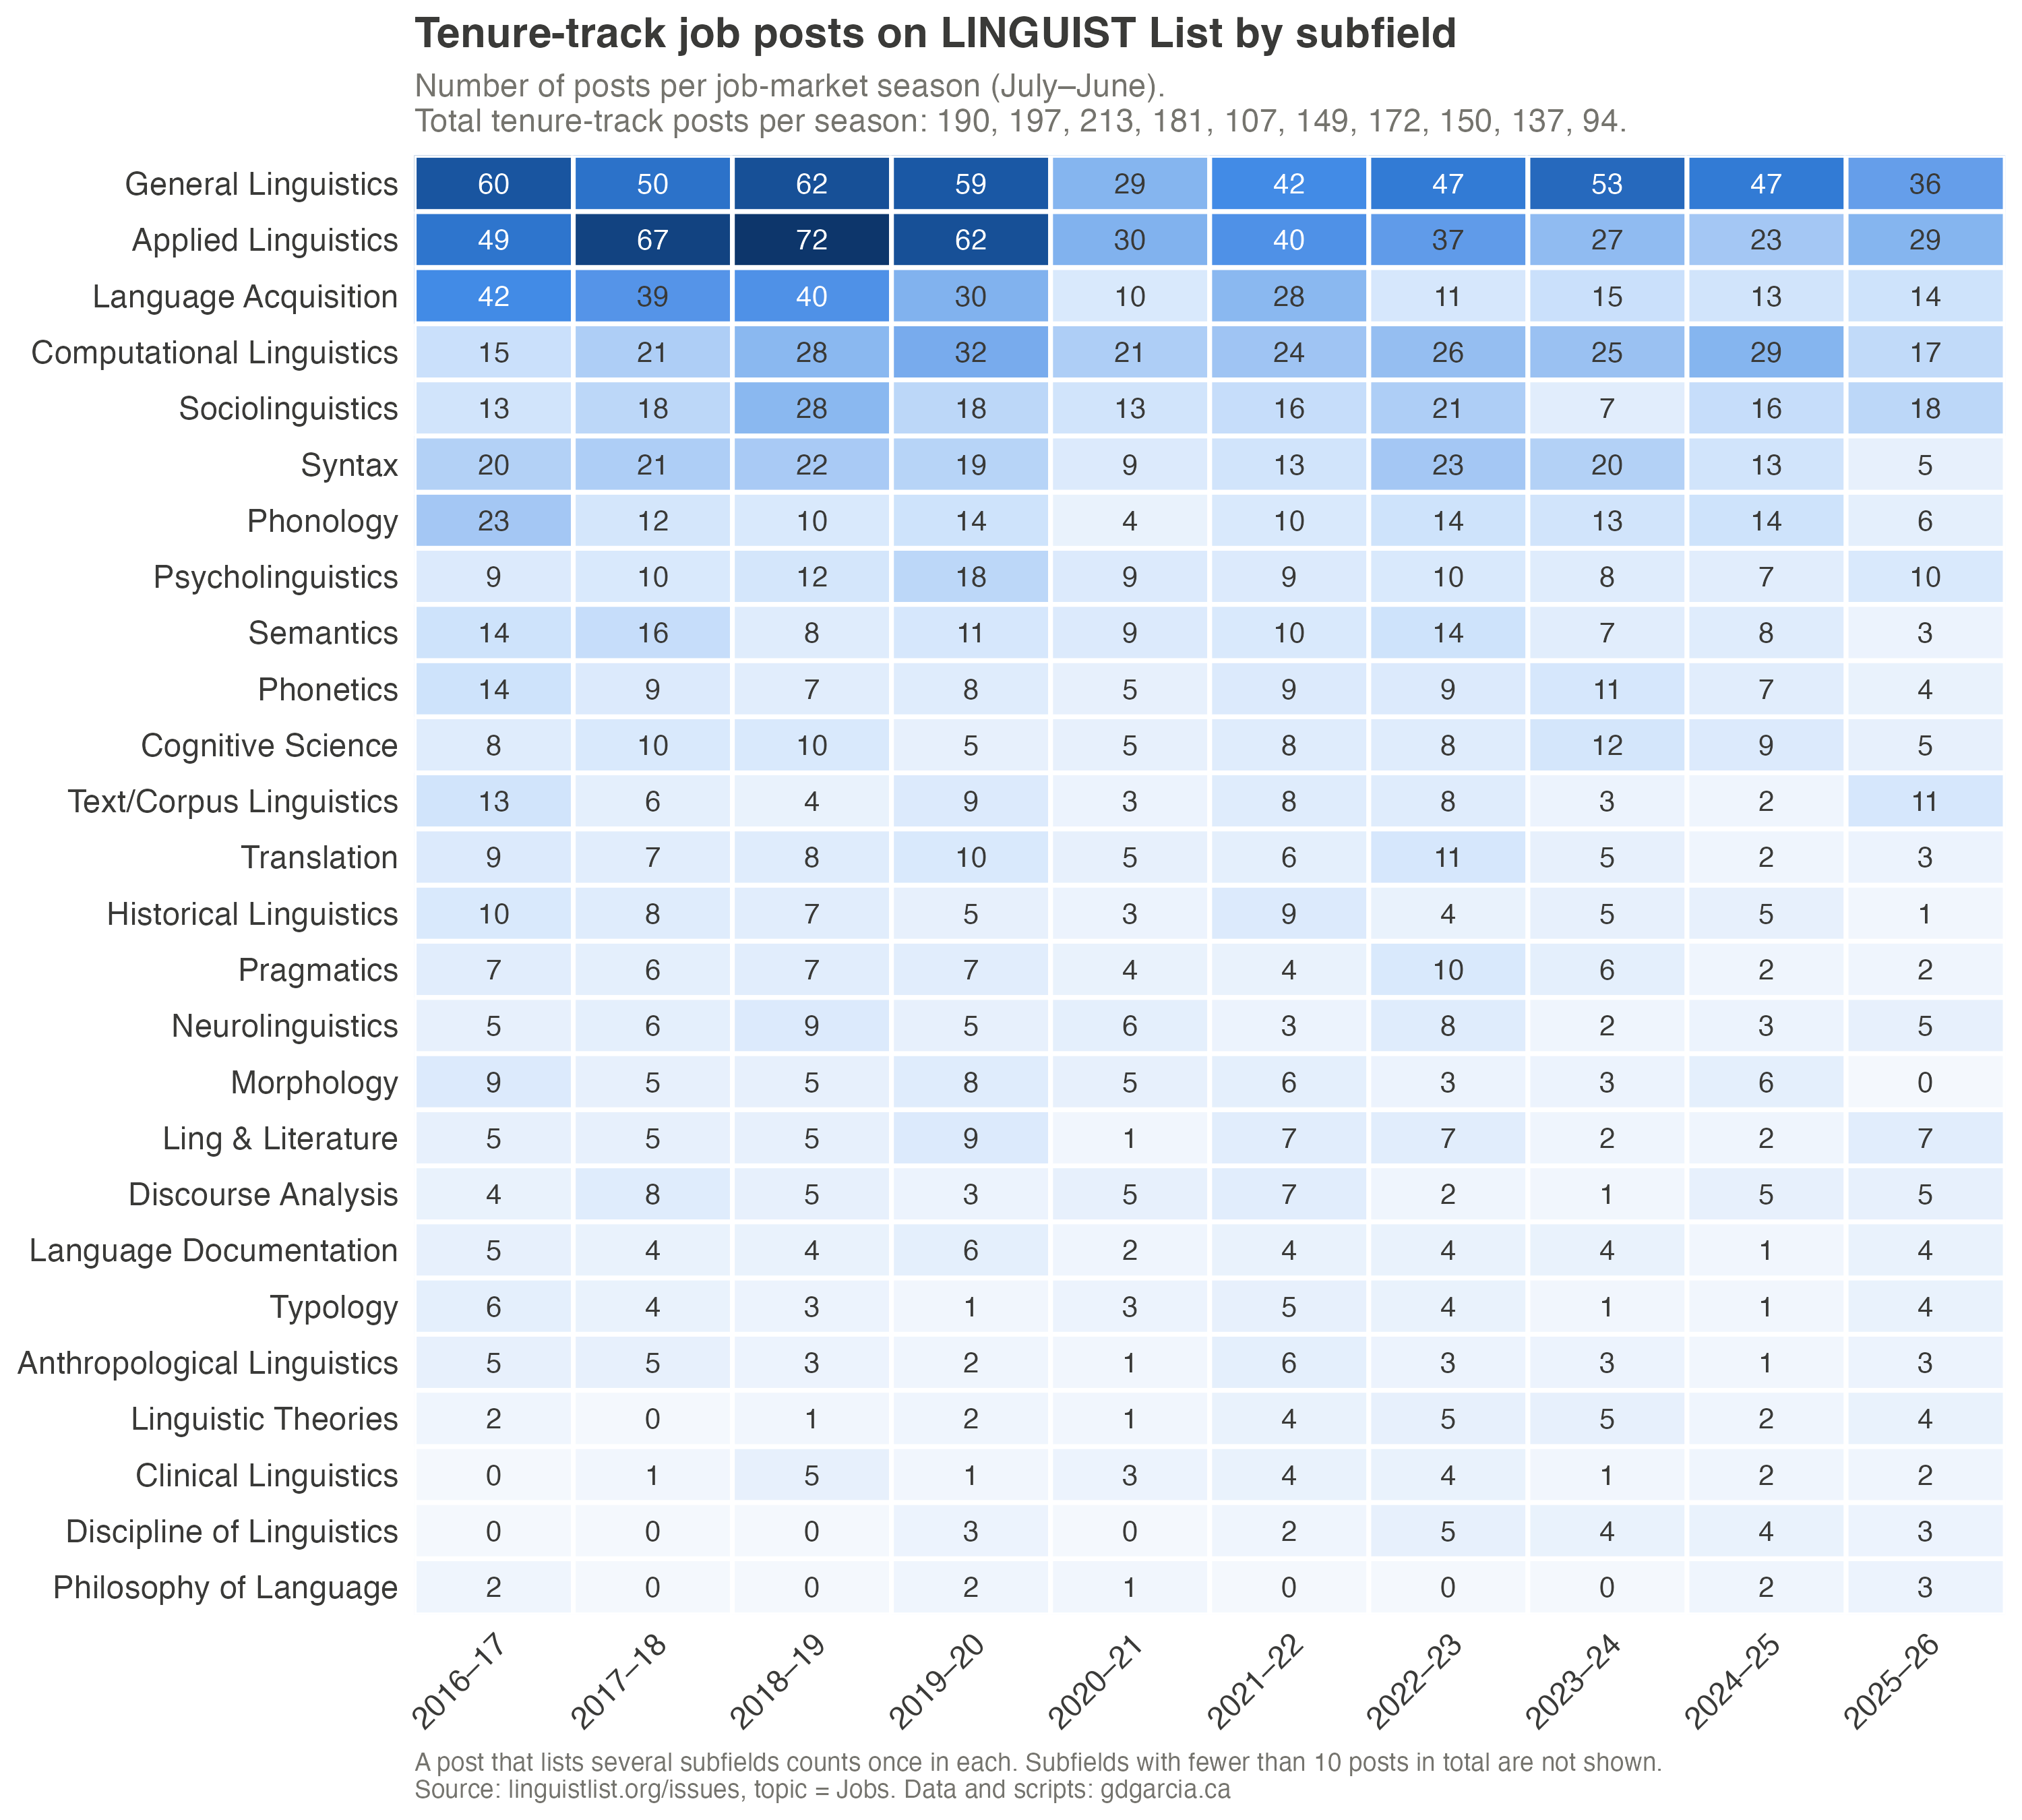
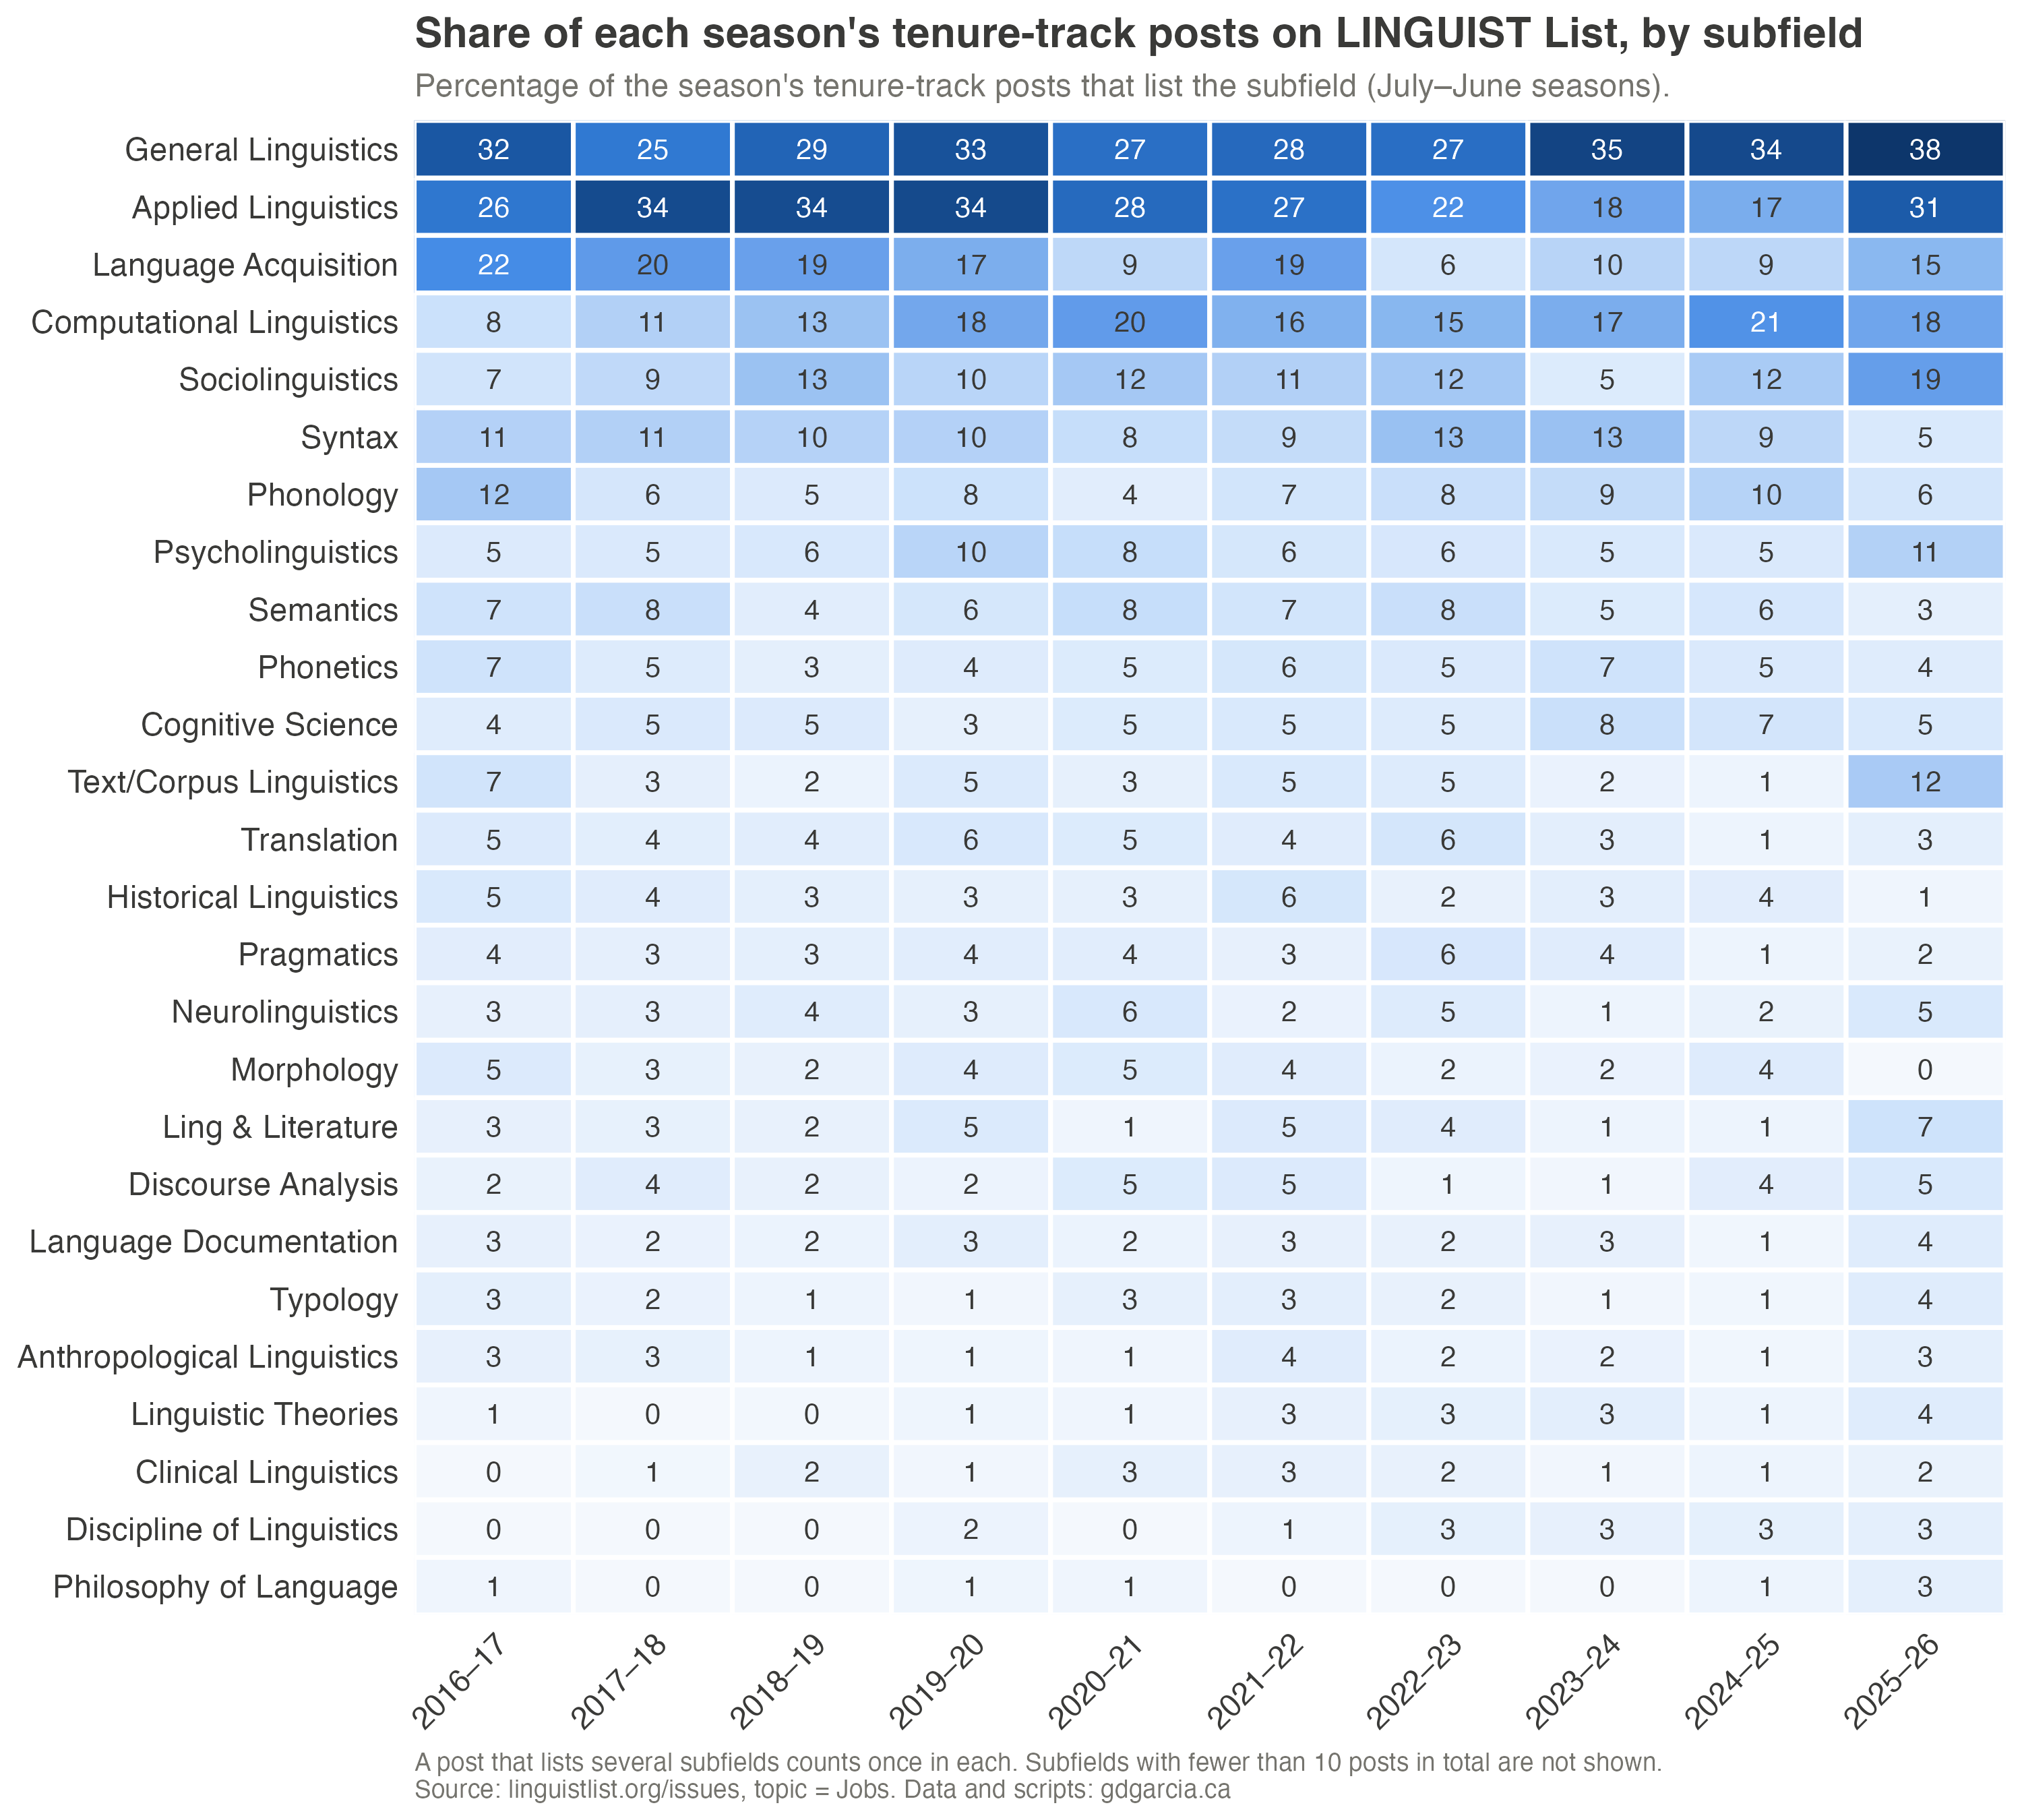
The second figure is the one to look at. The number of job posts on LINGUIST List fell sharply over the decade: from 637 in 2016–17 to 250 in 2025–26, considering all job types. Tenure-track posts went from about 190 to 94. Part of this may be a real decline in hiring, but part of it is almost certainly that fewer institutions advertise on LINGUIST List now. Raw counts mix those two things together, so the shares are more informative.
A few patterns:
- General Linguistics and Applied Linguistics dominate every season. That’s not very surprising: “General Linguistics” is the label used by departments that want a generalist (or that don’t want to commit to a subfield in the ad), and Applied Linguistics covers a lot of language departments.
- Computational Linguistics roughly doubled its share: 8% of tenure-track posts in 2016–17, and somewhere between 15% and 21% in every season since 2019–20.
- Language Acquisition went the opposite way, from about 20% of posts in the first four seasons to 6–19% since.
- Most theoretical subfields (syntax, phonology, semantics, phonetics, morphology) hover between 0% and 13% with no clear trend. Syntax at 5% in 2025–26 is the lowest value in the series, but with only 94 posts that season, I wouldn’t read much into a single year.
Caveats
A post that lists five subfields counts once in each, so shares don’t add up to 100%. Posters choose their own subfield labels, and they are not always careful about it. More importantly, LINGUIST List is just one channel. Many jobs in US language departments, for example, are advertised elsewhere, and none of this tells you how many applicants each subfield has, which is half of the story. Finally, a job ad is not a hire: searches fail, get cancelled, or get re-posted the following year.
So should you pick a PhD based on this figure? No. But if you’re choosing between two areas you like roughly equally, it doesn’t hurt to know that one of them has been doubling its share of the job market while the other has been shrinking.
The data (jobs.csv, one row per post) the Python scripts used to collect them and the R script for the figure are available in case you want to check my classification or slice the data differently.
Copyright © Guilherme Duarte Garcia