[1] 1
[1] 2 2
[1] 3 3 3
[1] 4 4 4 4
[1] 5 5 5 5 5Iterate functions with map
R
When your functions are too slow because they’re not vectorized,
map() can be a great alternative to for-loops.
I’m often in a situation where I have a function and I need to apply it iteratively to a lot of data. This is especially necessary for the package I maintain (Fonology). We want functions to be fast, of course. In R, this means we want it to be vectorized. Not coming from computer science, I find this topic quite interesting.
Not all functions can be vectorized, and that’s the issue. So what can we do? A common option is to run a for-loop. Here’s quick example: suppose you want to write a sequence of numbers where each number n repeats n times. Here’s one way to do that with a for-loop:
For-loops tend to do a great job if you don’t have too much data. They also tend to be intuitive, so if you’re not familiar with more exoteric functions, they are a very good place to start. That being said, it’s usually a good idea to avoid for-loops if there’s a better option out there (for-loops tend to be much slower). One common alternative is to use the apply() family of functions in R.
[1] 1 2 2 3 3 3 4 4 4 4 5 5 5 5 5A more recent option is to use the map() function from the purrr package, which is extremely useful. Here’s the same idea with map():
So, if you’ve created a non-vectorized function and now need to apply it to several inputs at once (say, to a whole column of data), you can use map() or apply() to speed up the process.
Using multiple functions
Here’s another example showing how useful the map() function can be. Suppose we want to sample from a population \(n\) times and take the mean of each sample to store it in a vector (dbl). We could do an easy for-loop to accomplish this task, but map_dbl() is a much more efficient way to do that.
library(tidyverse)

# Simulate a population:
set.seed(1)
pop = rnorm(n = 20000, mean = 5, sd = 5)

# Take 100 samples, each of size 50:
set.seed(1)
means = map_dbl(1:100, ~mean(sample(pop, size = 50)))

ggplot(data = data.frame(x = means), aes(x = x)) +
  geom_histogram(color = "white", fill = "darkorange2", alpha = 0.5, bins = 8) +
  theme_classic() +
  labs(x = "Means", y = NULL)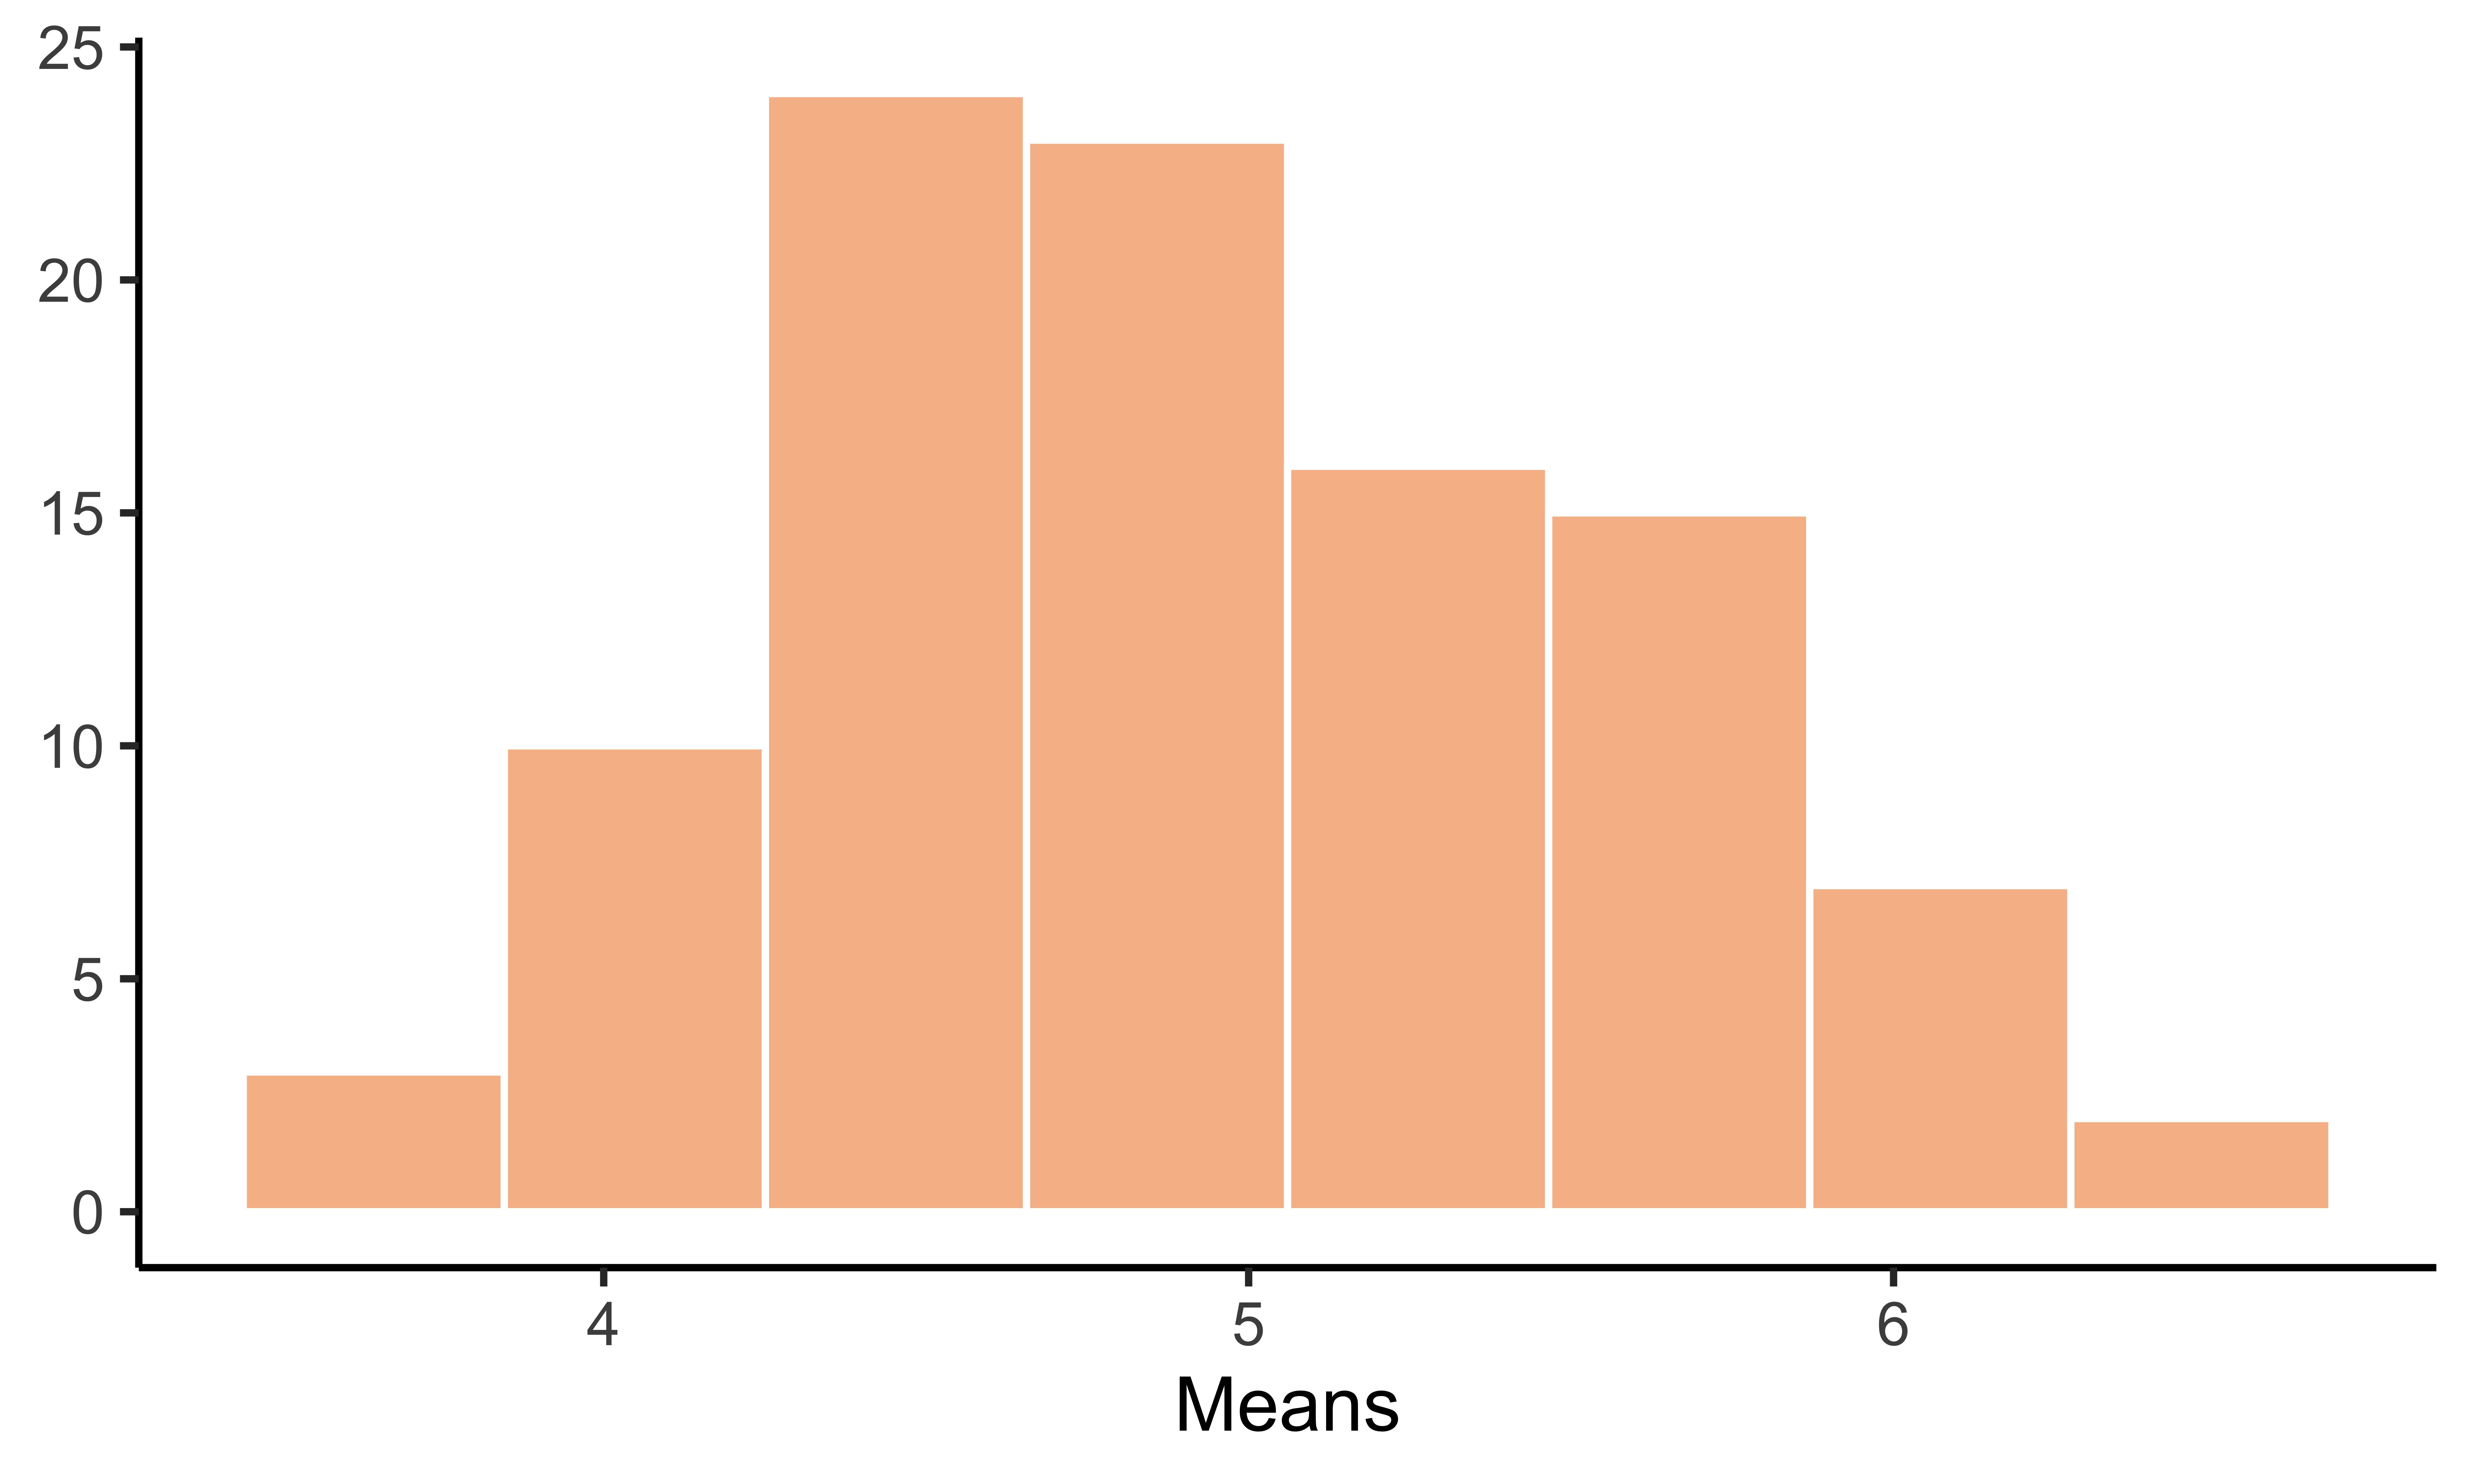
Copyright © Guilherme Duarte Garcia